Marine
Our extensive marine datasets have been compiled over the years through several programmes including INFOMAR and EMODnet.
To access specific datasets, with data download formats and software for viewing the data, click on any relevant links below:
Shoreline Change
Shoreline rates show how fast the coast is moving. They show if it is moving out towards the sea or back towards the land.
| Type | Source |
|---|---|
| Data Download | Zip file – Download Dublin Data Zip file – Download Wicklow Data |
| Map Viewer | Link to viewer |
| Web Services | Rest service Dublin Rest service Wicklow |
INFOMAR
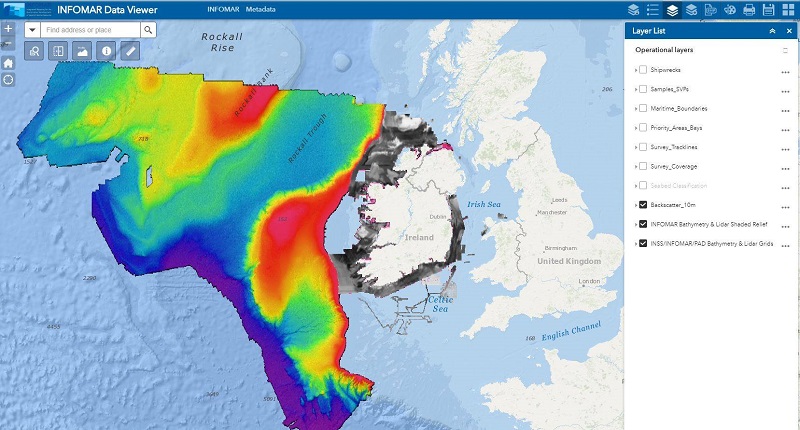
INFOMAR is the INtegrated Mapping FOr the Sustainable Development of Ireland’s MArine Resource Programme.
It is a twenty year programme to map Ireland’s seabed. INFOMAR is funded by the Department of the Environment, Cliamte and Communications (DECC), and delivered by joint management partners Geological Survey Ireland and the Marine Institute.
Official website
| Type | Source |
|---|---|
| Data Download | Link to portal Note, you may need to hard reload the Portal in your browser following recent maintenance. |
| Map Viewer | Link to viewer |
| Data.gov.ie | Link to Data.gov.ie website keyword ‘infomar’ |
| Web Services | Rest services Image Services |
| The Real Map of Ireland | Download PDF |
EMODnet Bathymetry
EMODnet is the European Marine Observation and Data network.
Developing and providing a harmonised Digital Terrain Model (DTM) of the seabed for European sea regions.
Official website
| Type | Source |
|---|---|
| Map Viewer | EMODnet Map Viewer |
| Products | Access the Products Catalogue |
EMODnet Geology
EMODnet is the European Marine Observation and Data network.
Developing and providing a harmonised Digital Terrain Model (DTM) of the seabed for European sea regions.
Official website
| Type | Source |
|---|---|
| Map Viewer | EMODnet Map Viewer |
| Products | Access the Products Catalogue |
Backscatter
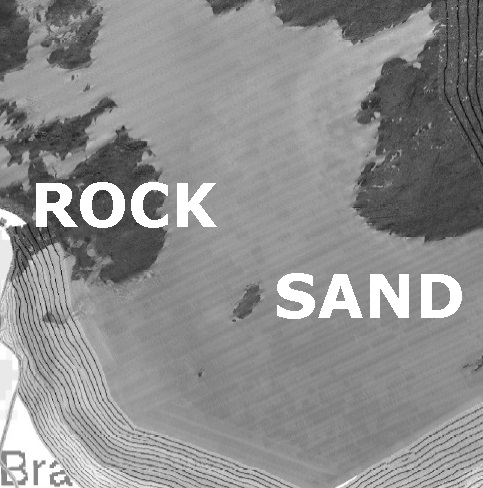
A Multibeam Echosounder (MBES) also measures the strength of the sound returning from the seabed, known as backscatter. Each seabed type (mud, sand, gravel, rock) is given a backscatter value, depending on the strength of the sound returned to the sonar head. Rocky areas have high returns. Soft sediments like sand absorb energy and have low backscatter returns. These values are used to make a grey-scale image with a dark colour for high returns (rocks) and a bright colour for low returns (sand).
Backscatter data formats.
| Image | Format | Software | Instructions |
|---|---|---|---|
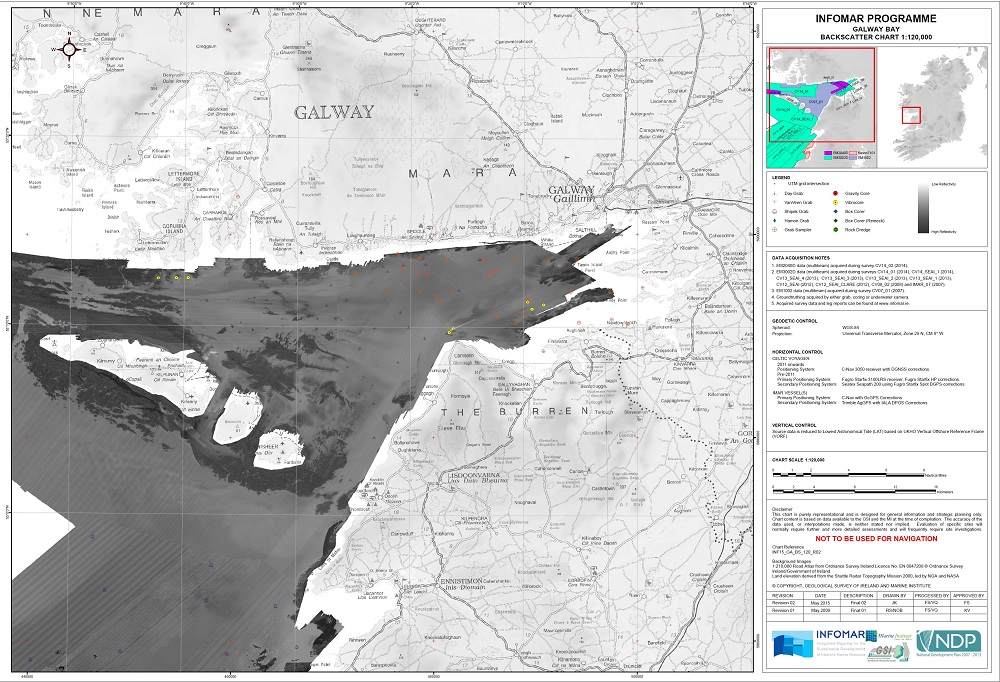 | PDF chart | Free Adobe | Download Charts |
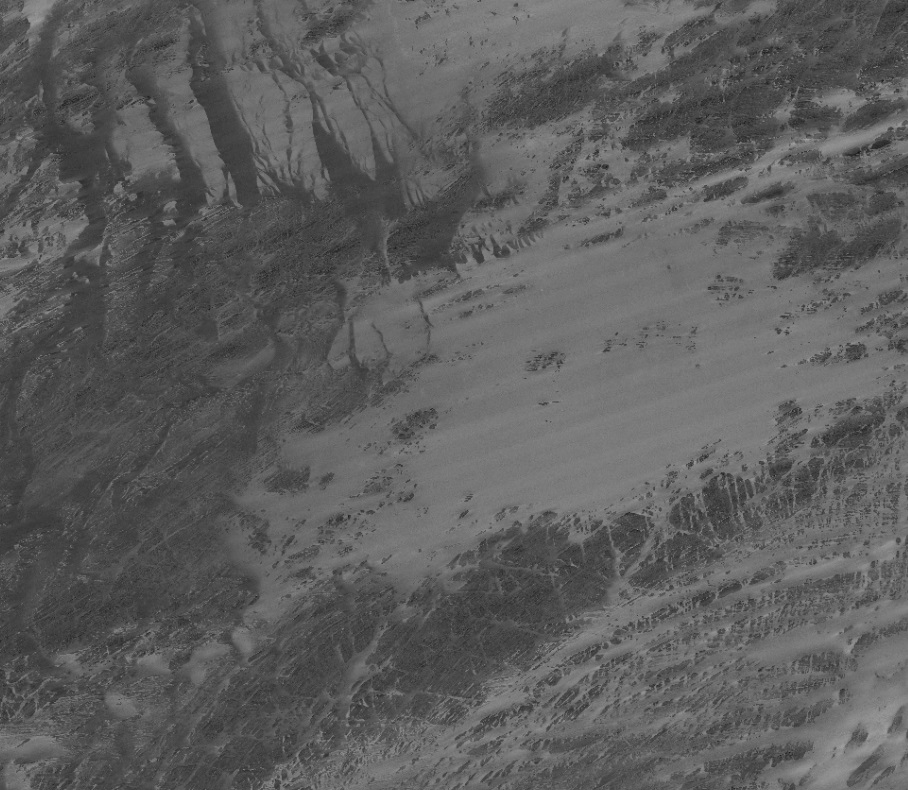 | Geotiff (.tif) | ArcGIS Earth (Free) ArcGIS PRO QGIS | INFOMAR Marine Data Download Portal Select Download Survey Leg Data or Download Entire Area Tab |
Bathymetry (shaded relief, water depth / underwater terrain)
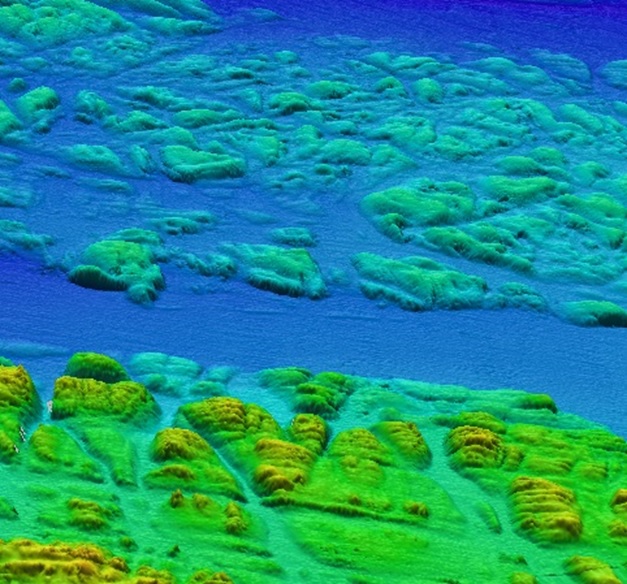
We use a Multibeam Echosounder (MBES) on a boat to determine water depth. The depth is calculated based on the time it takes the sound to be emitted from the sensor, hit the seabed and bounce back. The water depth maps are known as “Bathymetry Maps”. We use software called Fledermaus to get the 3D effect. By using vertical exaggeration, artificial sun-shading (mostly as if there is a light source in the northwest) and colouring the depths using colour maps, it is possible to highlight the subtle relief of the seabed. These are known as “Shaded Relief Bathymetry Maps”.
Bathymetry data formats.
| Image | Format | Software | Instructions |
|---|---|---|---|
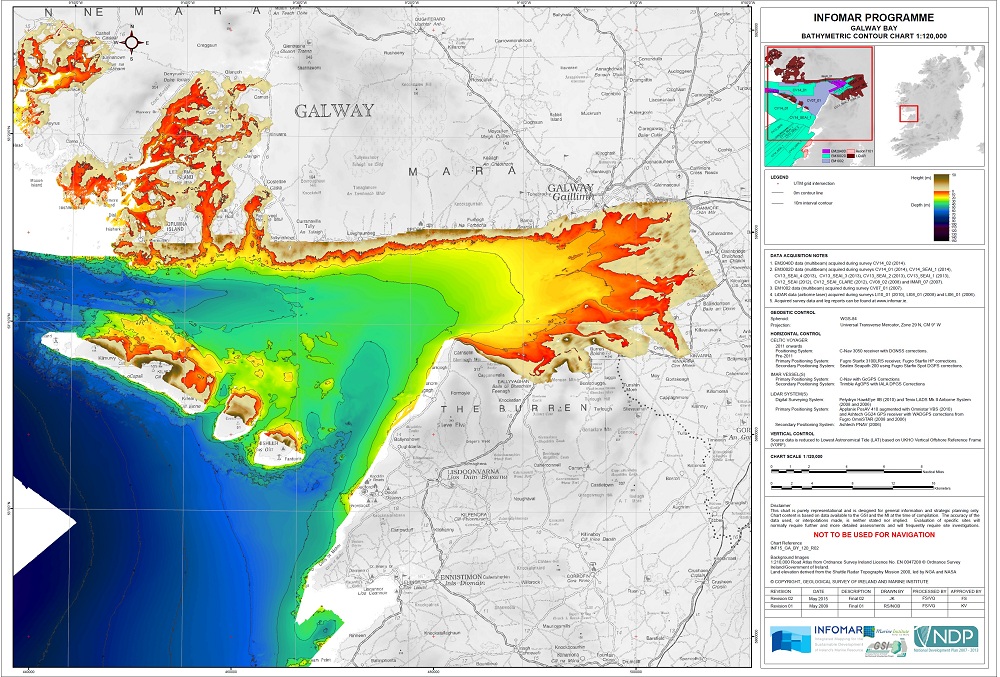 | PDF chart | Free Adobe | Download Charts |
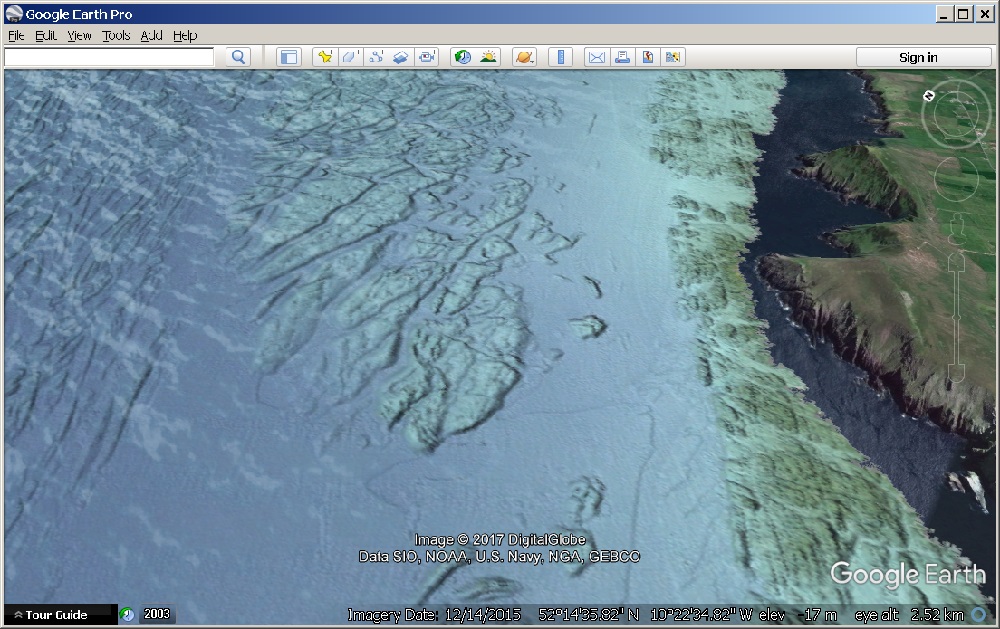 | Google (.kmz) | Free Google Earth | Download KMZ See Google Earth Column |
 | Grid XYZ | ArcGIS PRO QGIS | INFOMAR Marine Data Download Portal Select Download Survey Leg Data Tab – Select Download Survey Leg Data – Select Download XYZ |
 | Shaded Relief Bathymetry GeoTiff | ArcGIS Earth (Free) ArcGIS PRO QGIS | INFOMAR Marine Data Download Portal Select Download Survey Leg Data Tab – Select Download Survey Leg Data -Select Download Shaded Relief Geotiff |
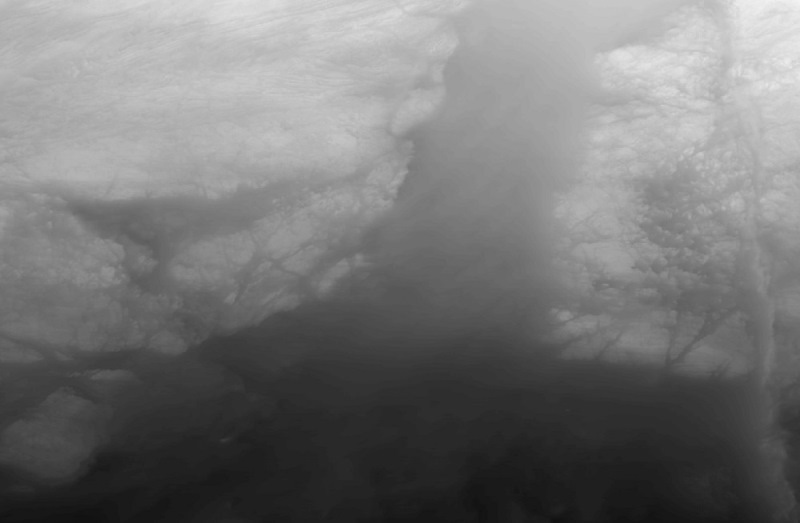 | Floating Point Geotiff Grid | ArcGIS Earth (Free) ArcGIS PRO QGIS | INFOMAR Marine Data Download Portal Select Download Survey Leg Data Tab – Select Download Survey Leg Data – Select Download Bathymetry GeoTiff |
Sub-bottom (SEGY)
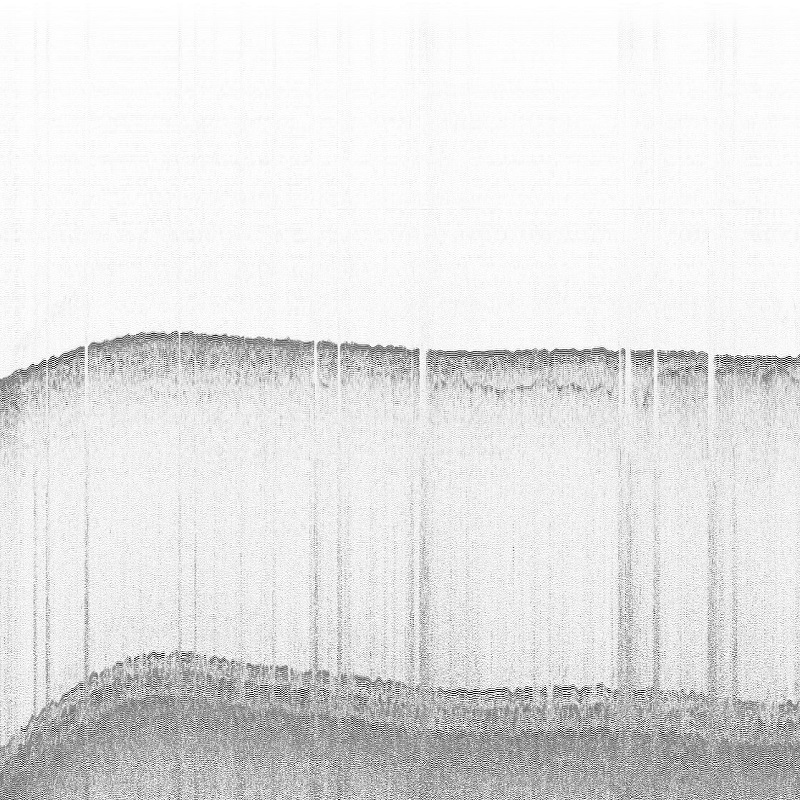
The SBP family includes various types of systems including ‘Pinger’ systems which transmit a single frequency (~4 kHz) and ‘Chirp’ systems which transmit a sweep of frequencies (e.g. 2-10 kHz) in a single pulse. These systems use lower sound frequencies that penetrate further into the sediment and examine sediment layers and the extent of bedrock.
| Image | Format | Software | Instructions |
|---|---|---|---|
 | SEGY | Seismic data softwares | INFOMAR Marine Data Download Portal Select Survey Leg Data Tab – Select Download Survey Leg Data – Select Download SEGY |
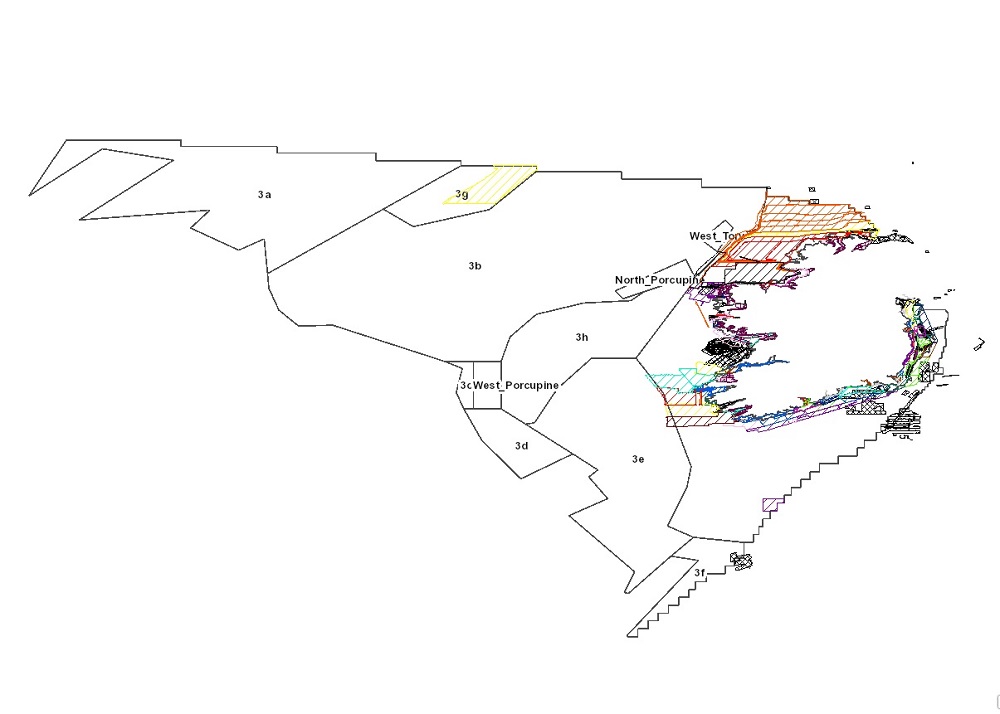 | Online | Any browser | INFOMAR Data Viewer See Sub-bottom Profile Availability and Sub-bottom Profile Tracklines layers. |
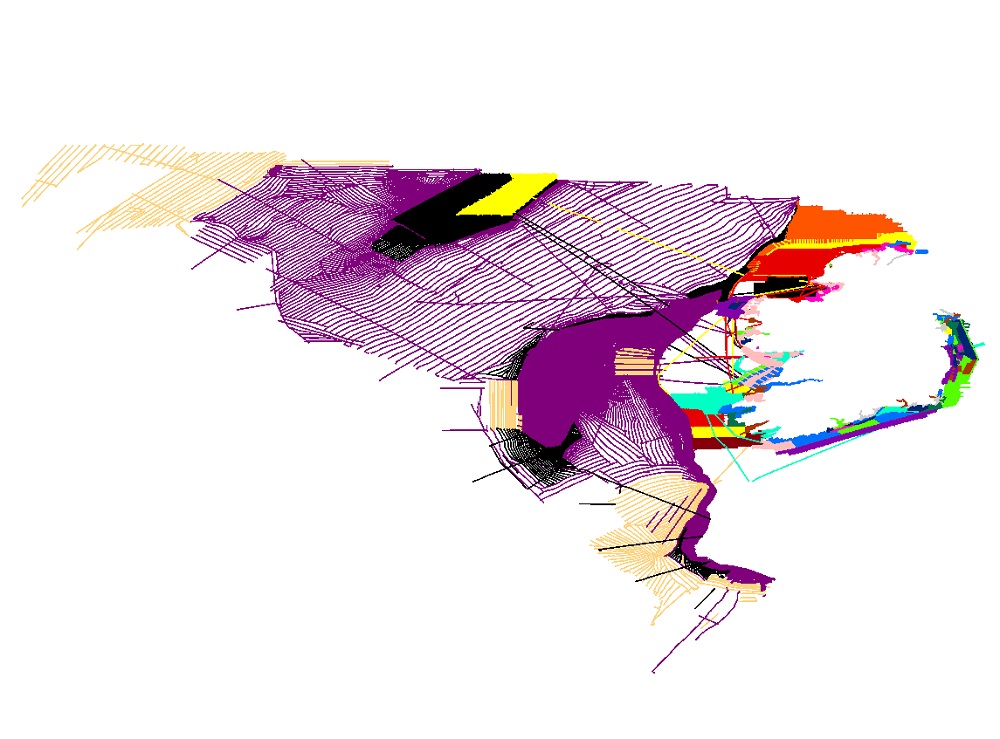 | Shapefile | ArcGIS Earth (Free) ArcGIS PRO QGIS | INFOMAR Marine Data Download Portal Select Download Vector Datasets Tab for Sub-bottom Tracklines Shapefile. |
Geology
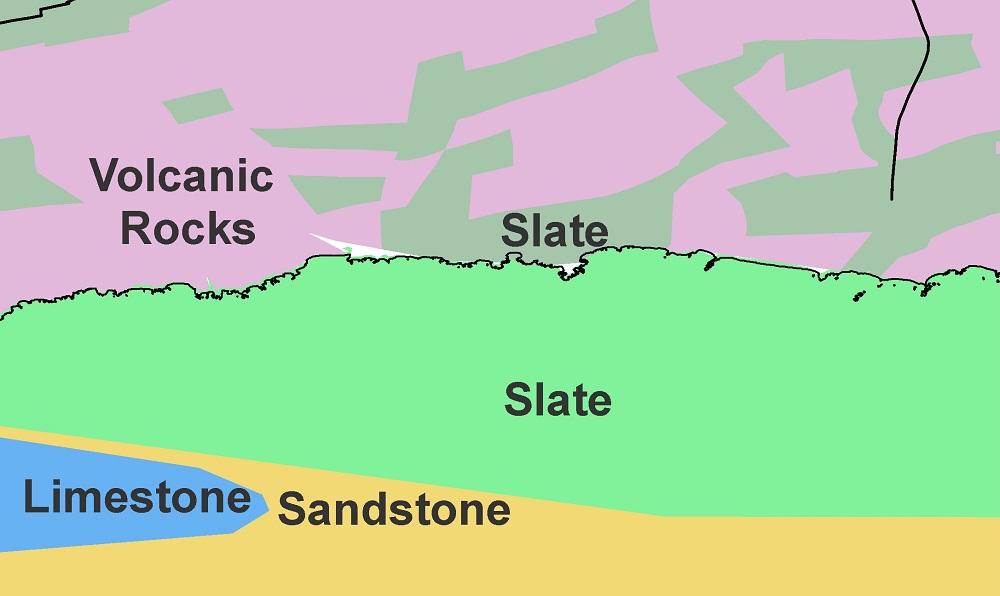
The Onshore Geology map is the Bedrock Geology 1:1 Million scale map. The Seabed geology 1:1 Million scale map was compiled for the EMODnet Geology project (lithology).
Geology data formats.
| Image | Format | Software | Instructions |
|---|---|---|---|
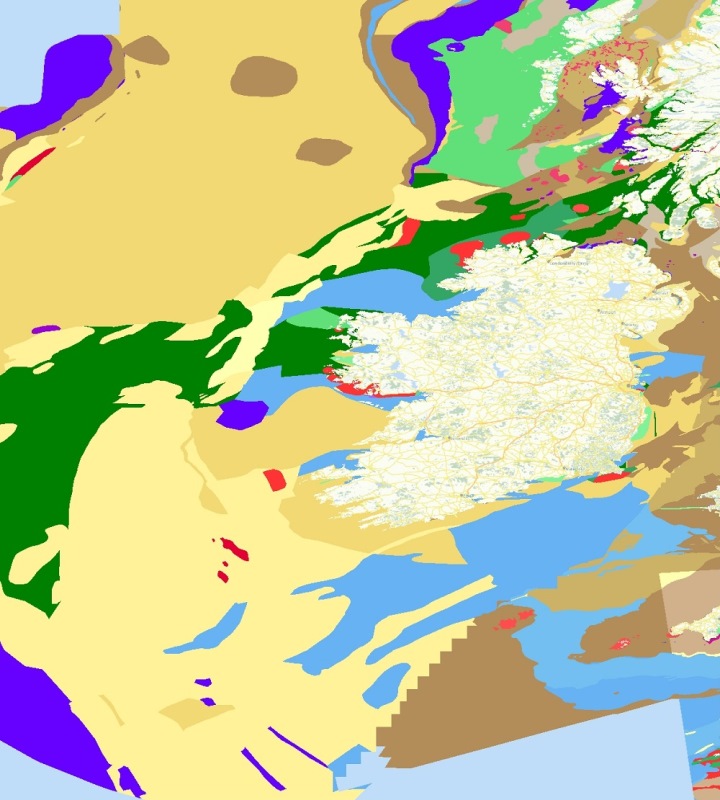 | Shapefile | ArcGIS Earth (Free) ArcGIS PRO QGIS | INFOMAR Marine Data Download Portal Select Download Vector Datasets Tab for offshore shapefiles |
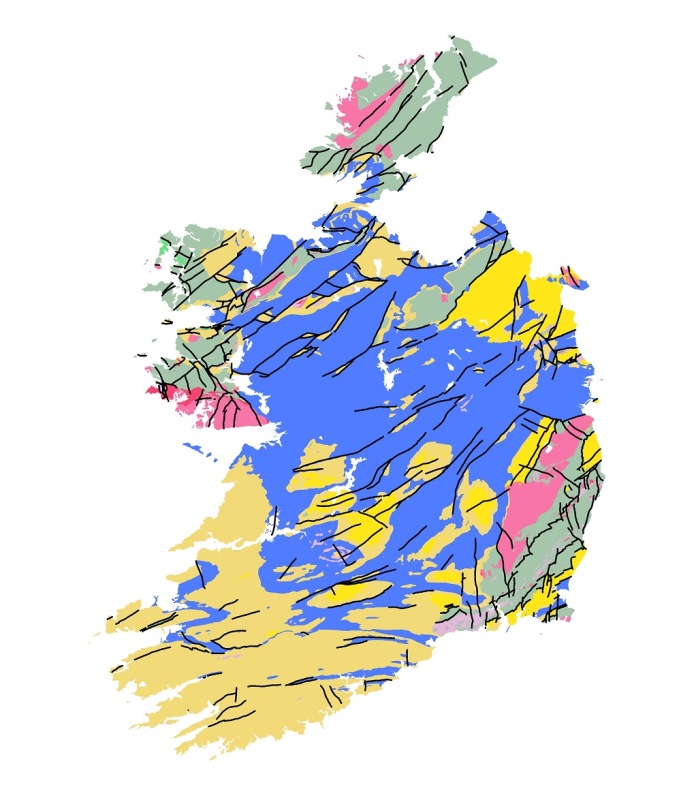 | Shapefile | ArcGIS Earth (Free) ArcGIS PRO QGIS | Bedrock For onshore shapefile see ‘Bedrock Geology 1 Million’ |
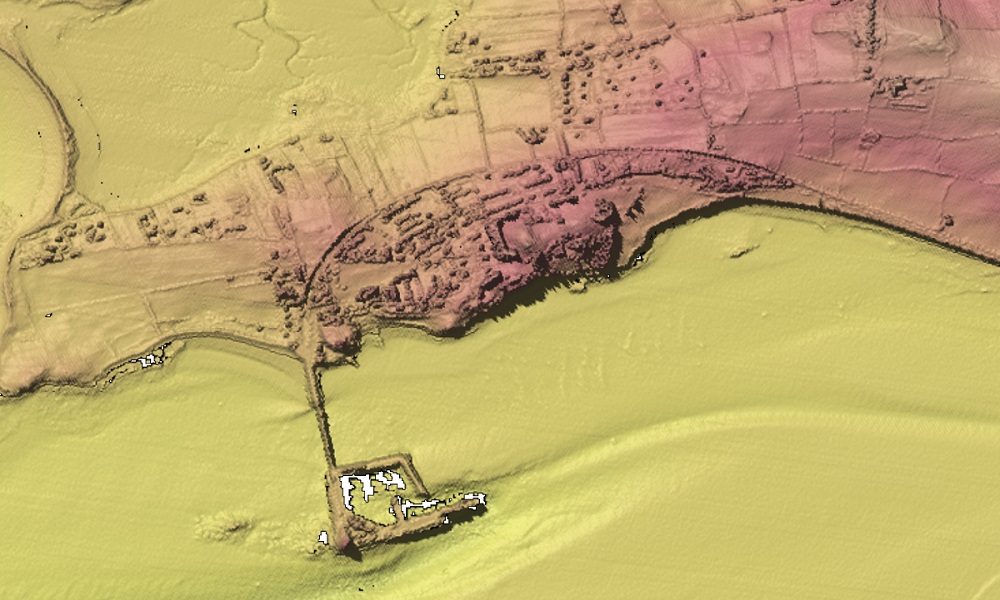
This method of surveying emits two laser light beams from a sensor on-board an airplane. The red beam reaches the water surface and bounces back, while the green beam penetrates the water hits the seabed and bounces back. The difference in time between the two beams returning allows the water depth to be calculated. Digital photographs can also be taken using a downward looking geo-referenced digital camera. We use software called Fledermaus to get the 3D effect. By using vertical exaggeration, artificial sun-shading (mostly as if there is a light source in the northwest) and colouring the depths using colour maps, it is possible to highlight the subtle relief of the seabed/landscape. These are known as “Shaded Relief Lidar Maps”.
Lidar data formats.
| Image | Format | Software | Instructions |
|---|---|---|---|
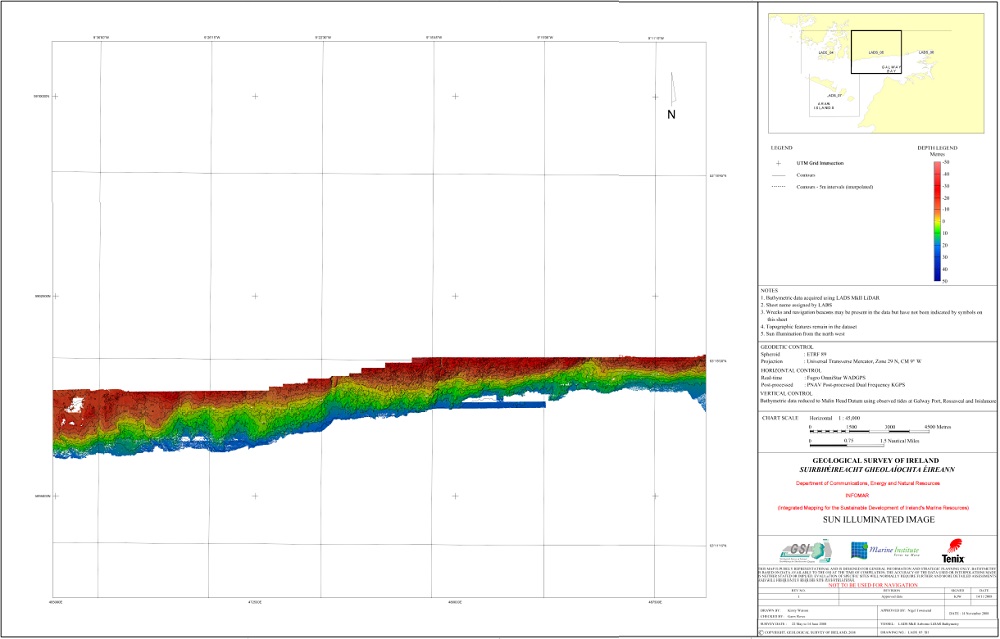 | PDF chart | Free Adobe | Download Charts |
 | Geotiff (.tif) | ArcGIS Earth (Free) ArcGIS PRO QGIS | INFOMAR Marine Data Download Portal Select Download Survey Leg Data Tab – Type ‘LI_’ into search to see LiDAR Survey Legs |
| ESRI ArcGIS GRID | ArcGIS PRO QGIS | INFOMAR Marine Data Download Portal Select Download Survey Leg Data Tab – Type ‘LI_’ into search to see LiDAR Survey Legs |
| Grid xyz(.dat) | ArcGIS PRO QGIS | INFOMAR Marine Data Download Portal Select Download Survey Leg Data Tab – Type ‘LI_’ into search to see LiDAR Survey Legs |
Maps available for download
| Image | Format | Software | Instructions |
|---|---|---|---|
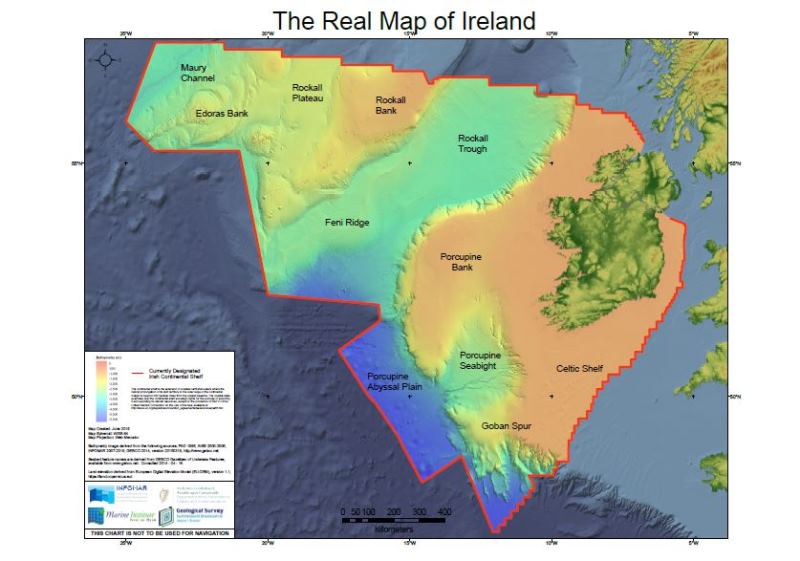 | PDF Map | Free Adobe | Download PDF The Real Map of Ireland |
| PDF Map | Free Adobe | Download Charts |
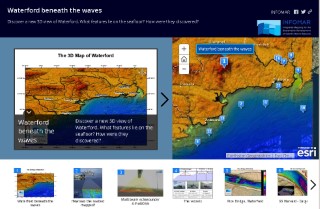 | Online | Any browser | View Story Maps |
Seabed Habitats & Substrate
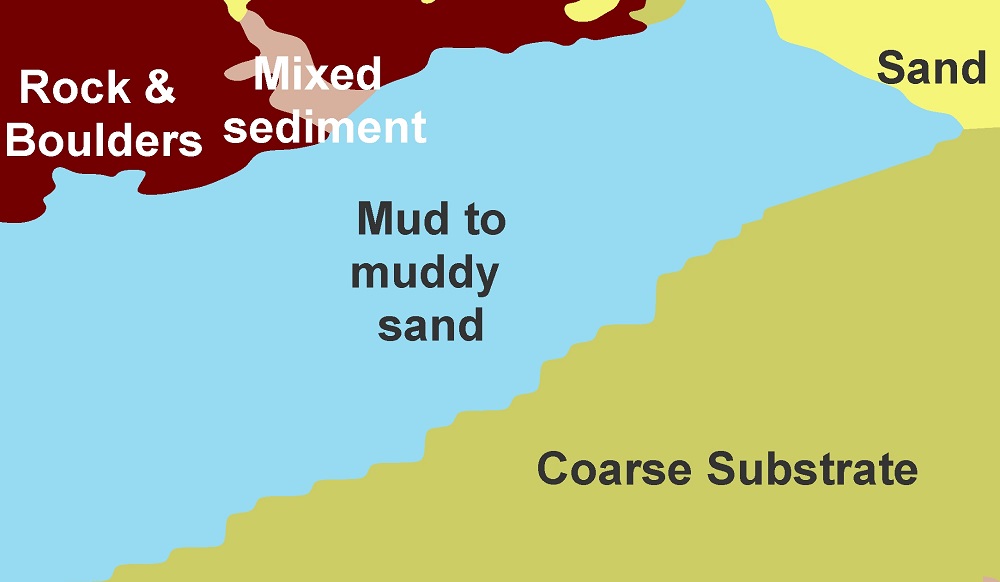
The seabed substrate map is created by grouping seabed areas that are alike. We use the bathymetry, backscatter and seabed samples data to select these areas.
EMODnet Geology WP3 Seabed substrate map. This is a broad scale map (1: 250 000 scale) collected and harmonised by the EMODnet-Geology partners. It is classified using the Folk schema (7 classes).
INFOMAR have produced more detailed Seabed Classification maps for some areas around the Irish coast.
Seabed Habitats data formats.
| Image | Format | Software | Instructions |
|---|---|---|---|
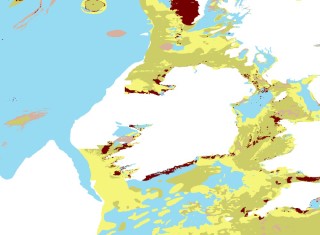 | Shapefile | ArcGIS Earth (Free) ArcGIS PRO QGIS | INFOMAR Marine Data Download Portal Select Download Vector Datasets Tab for Sediment Classification Shapefile. |
| | Online | Any browser | EMODnet Map Viewer See EMODnet Geology – Seabed Substrate Layers. Shapefiles can be downloaded from layer info. |
Seabed Samples
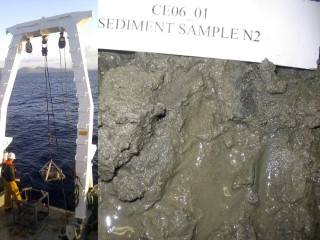
We collect sediment samples from the seabed.
Looking at the samples along with the bathymetry and backscatter maps allows us to group seabed areas of similar nature, and create seabed habitat maps.
Seabed Sample data formats.
| Image | Format | Software | Instructions |
|---|---|---|---|
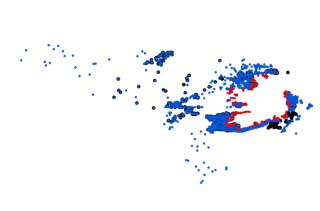 | Shapefile | ArcGIS Earth (Free) ArcGIS PRO QGIS | INFOMAR Marine Data Download Portal Select Download Vector Datasets Tab for Sediment Samples Shapefile. |
| | Online | Any browser | Seabed & Sediment Viewer See Sample Points layer |
Shipwrecks
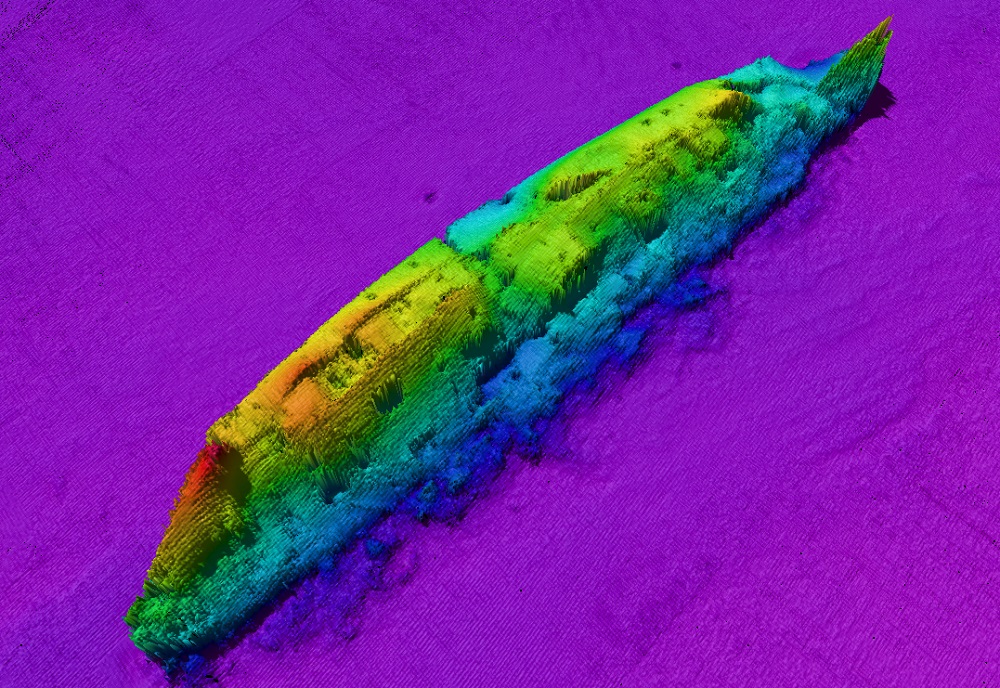
We map shipwrecks.
Shipwreck data formats.
| Image | Format | Software | Instructions |
|---|---|---|---|
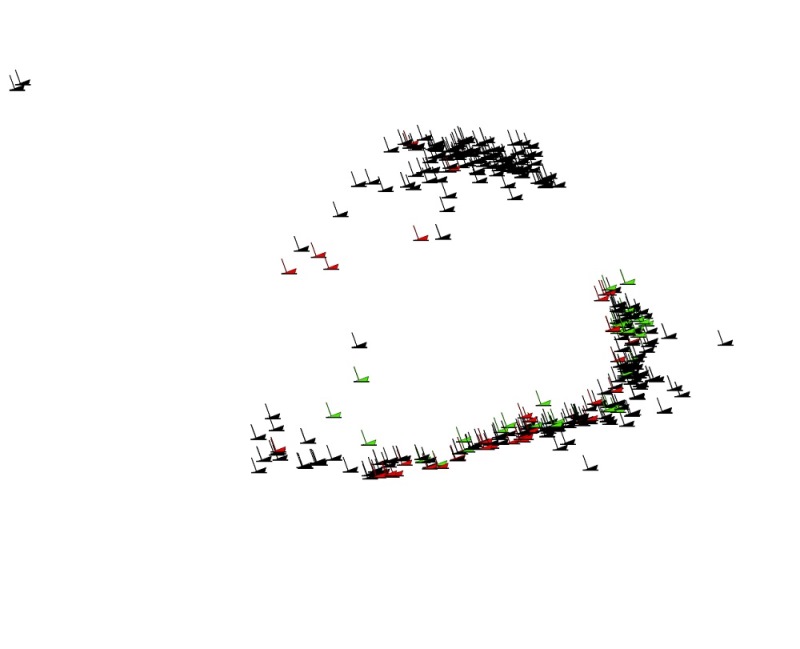 | Shapefile | ArcGIS Earth (Free) ArcGIS PRO QGIS | INFOMAR Marine Data Download Portal Select Download Vector Datasets Tab for Shipwrecks Shapefile. |
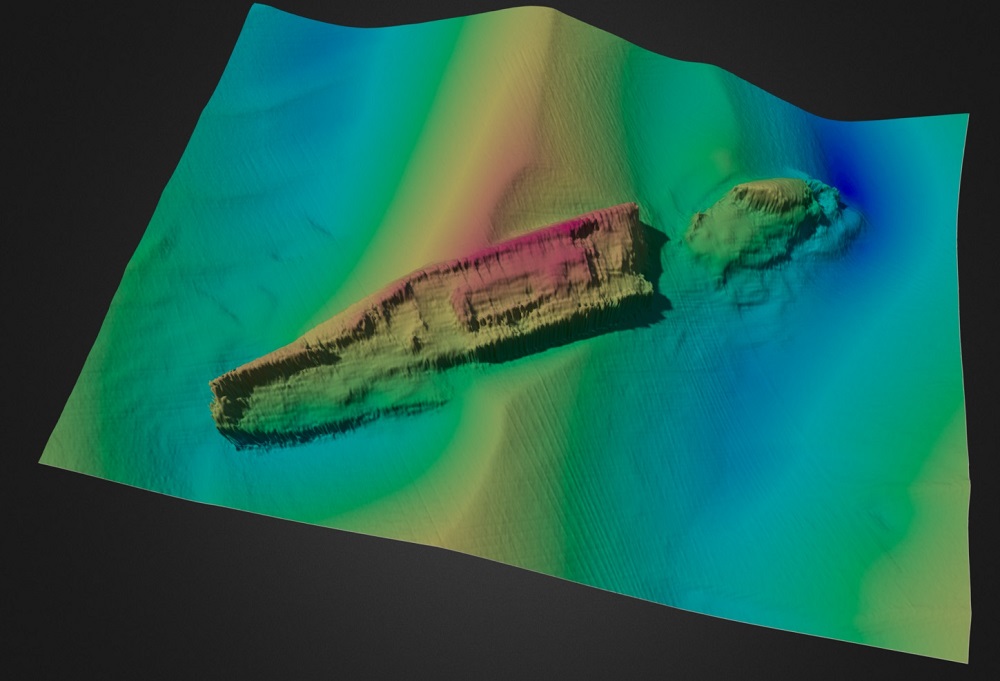 | Online | Any browser | View 3D Models |
Survey Coverage & Reports
Download the Survey Coverage polygons & track lines.
You can also download the Survey Leg Reports.
| Image | Format | Software | Instructions |
|---|---|---|---|
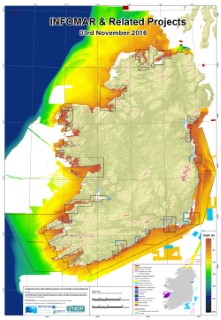 | PDF Chart | Free Adobe | Download Charts |
| Shapefile | ArcGIS Earth (Free) ArcGIS PRO QGIS | INFOMAR Marine Data Download Portal Select Download Vector Datasets Tab for Survey Coverage Shapefile. |
| Shapefile | ArcGIS Earth (Free) ArcGIS PRO QGIS | INFOMAR Marine Data Download Portal Select Download Vector Datasets Tab for Survey Tracklines Shapefile. |
 | PDF, .doc,.xls | Free Adobe | INFOMAR Marine Data Download Portal Select Download Survey Leg Data for individual Survey Leg Reports. |